Our employee engagement and wellbeing solutions are designed to empower leaders, managers and employees to measure, analyze and improve on their workplace performance. To be able to do all that, we pay special attention to our customer needs and listen to their feedback to constantly deliver the best possible solutions.
We want to make sure that our customers use our products at their full potential. Therefore, we decided to create a series of monthly posts where we dive deeper into some of the most used features and also some functionality our clients might have missed from our products.
Situations may arise where you are asked to deliver a report consisting of data not directly supported by the configured categories in your polls. Such cases might be, for example:
- A report consisting of multiple, very small teams combined as one in order to preserve anonymity
- Ad hoc report combining some - but not all - organisational functions
- Regional report combining only a few specific locations
- Creating a link to an existing report which further organises/combines/ refines it:
- When to use: if it is okay for the viewer of the aggregate report to view the poll data in its original “unaggregated” form. For the sake of clarity, let’s call this report a “sensitive aggregate report”.
- Pros: easy and quick, no need to change poll configuration, anyone who has access to any report can easily create such a link.
- Cons: viewer of the aggregate report can see all the data of the existing report (for example if the existing report shows teams and a new link showing a report which combines teams is created, the viewer of the aggregate report still has the option to view the teams separately).
- Creating a new share URL to a poll which only shows the combined data:
- When to use: if it is not okay for the viewer of the aggregate report to view the same data in its original “uncombined” form. Because the original - perhaps sensitive - categorisation is not revealed to the report viewer, let’s call this report “safe combined report”.
- Pros: Viewer of the report will only see the combined data (for example aggregate of three teams) with no way of seeing the original data (for example knowing which feedback came from which team).
- Cons: Poll configuration must be modified by adding a new Share URL
In order to demonstrate how to create both types of reports, let’s assume we have the following categorisations defined in our poll:
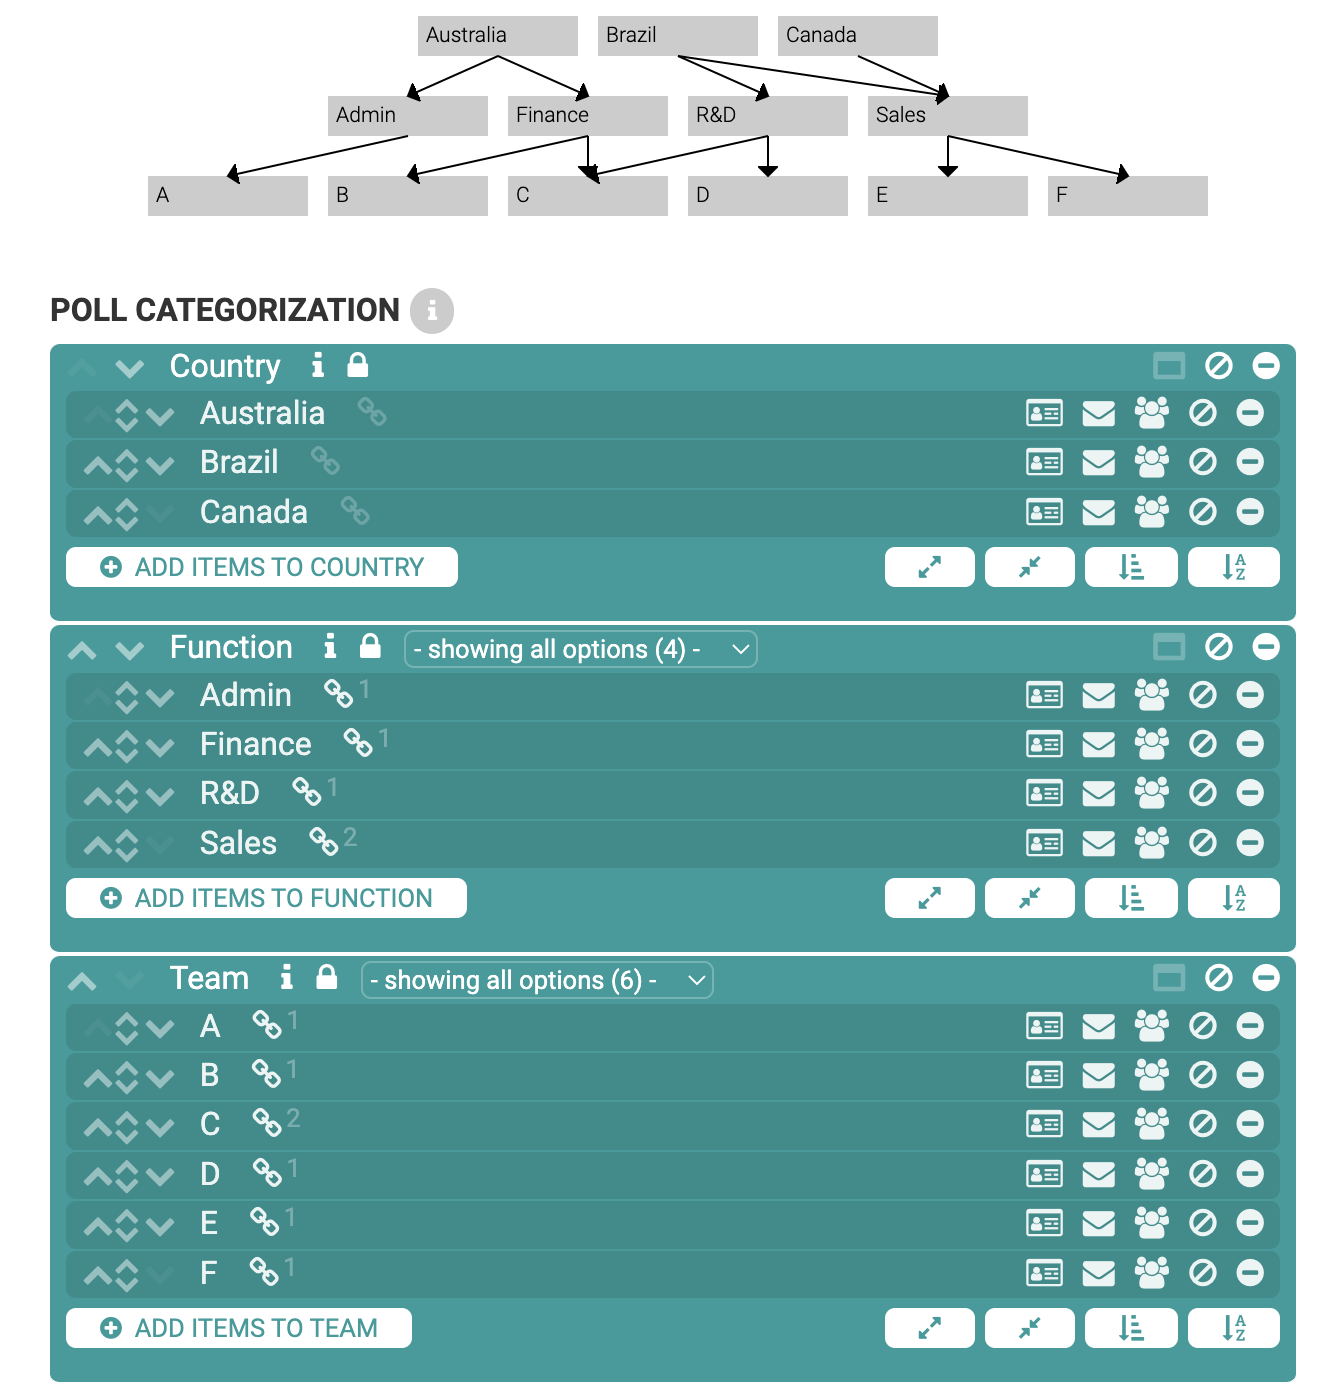
- Everything from Australia
- Everything from R&D
- Everything from Team F
In practice - as you can see from the organization chart from above - the report will contain all data except results from Team E (any feedback located in Brazil without any Function or Team information would be excluded as well). To achieve the same result, you could simply pick all teams except Team F, but by creating the report the way described above demonstrates that:
- You can mix and match various organisational levels as required without any limitations.
- You don’t have to care about “feedback being counted multiple times” even if that data is selected more than once (for example Team C in our demonstration is selected twice as it is both part of Australia and R&D, but we don’t have to care about that - the data from Team C is counted only once).
Creating a sensitive aggregate report
In order to share this aggregate report you just created, click the bookmark button in the bottom right of the filter bar. You will then be presented with a pop-up window containing the link to the exact same report.

- If you viewed the original report not via Share URL but by logging into VibeCatch with your own username and password, your colleague will be required to enter a valid username and password in order to view the aggregate report. If you accessed the original report via Share URL, everyone who gets hold of the bookmark link can view the report as the original Share URL is viewable by everyone - your bookmark is simply a refinement of that same report.
- Keep in mind that the report recipient can always “undo” the aggregate and view country, function and team -specific data separately by simply unchecking the checkbox.
Creating a safe combined report
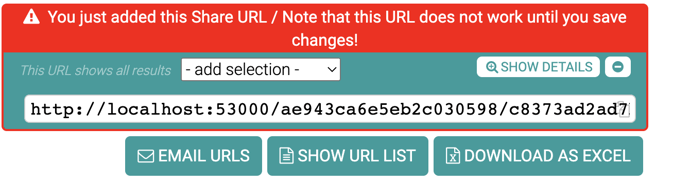
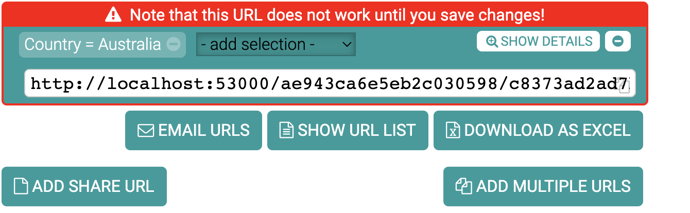
In order to create a safe combined report, we go to the poll’s settings and select the “Sharing of poll results” and create a new Share URL as usual (which by default will be showing all poll data) by clicking “Add share URL”-button:
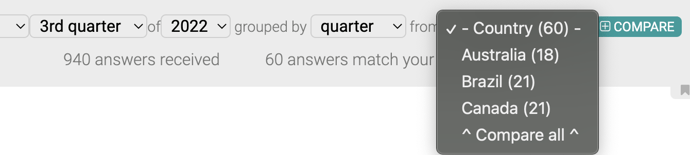
 Then choose the first of the three sets of categories we want in the report “Australia”:
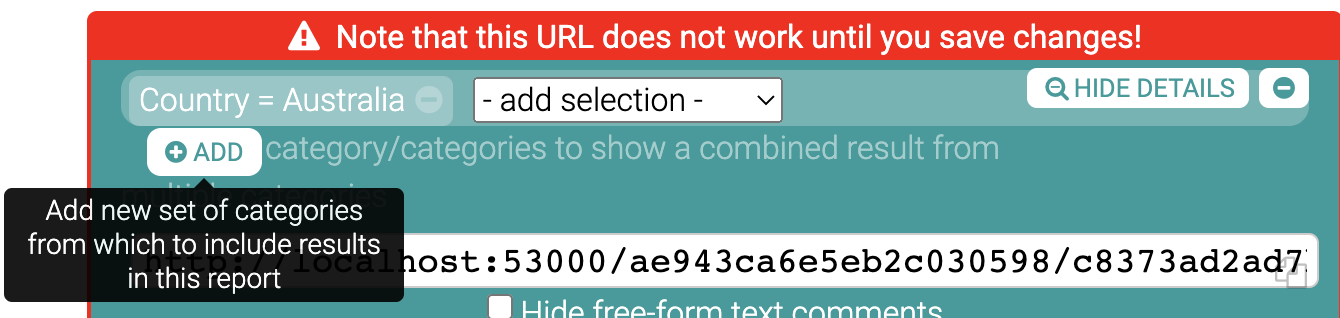
 To add the other categories from which data should be combined to the report click “Show details” and click the Add-button below the “Country=Australia”:
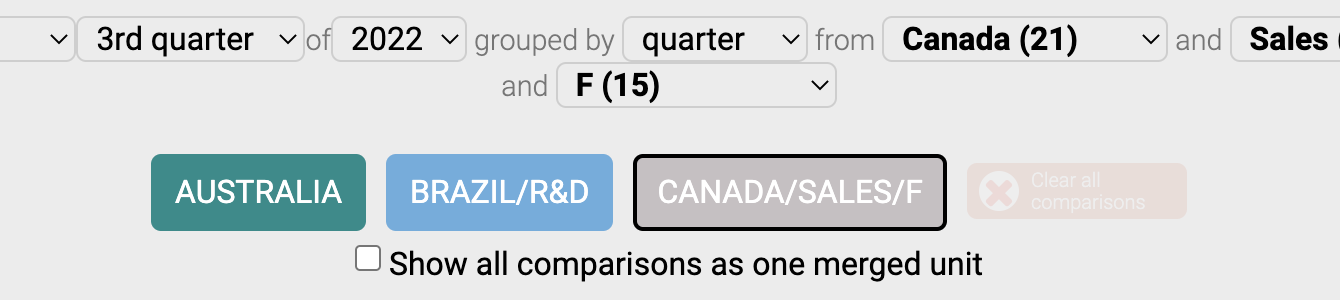
After clicking “Add”, choose the other relevant categories and add them to the report (choose Brazil, then R&D and then click “Add”, then choose Canada, Sales, F, and click “Add”)
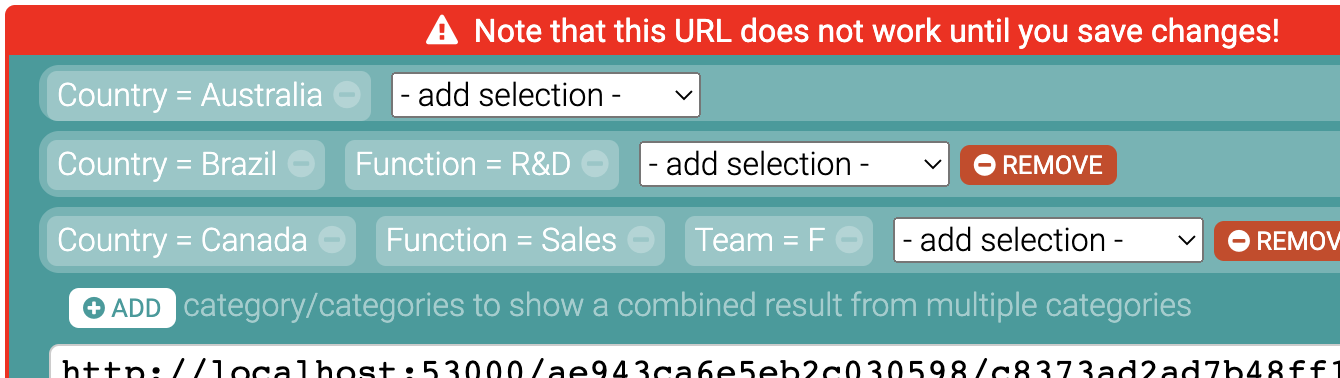
The report has now been configured. After you save the changes, you can distribute the Share URL any way you see fit.
Remember, that:
- As the link is a Share URL defined in the poll’s settings, anyone with the link can view the report - even if they do not have VibeCatch username or password - so distributing the report is really easy.
- As the link will be a “safe report”, the report recipient can not “uncombine” the report data. However, by default all the categorisation information in the report is shown, so the report viewer can see, for example, if a piece of text feedback is from Team F as the categorisation information is listed next to the text feedback. In order to hide this categorisation information, check the checkboxes related to the categories you selected into the combined report (the page will display a warning icon and a text “Hiding?” next to the relevant checkboxes you might possibly want to hide).

What is VibeCatch?
VibeCatch is an HR platform based on 15 years of proven research, offering you the opportunity to make a genuine difference and understand the impact that your working environment has on your staff.
Through VibeCatch’s QWL Polls, Pulse Polls and 360 Feedback Polls, you can uncover hidden staffing opportunities, correct issues and address areas of improvement for both employees and management within your organisation.
Speak to our team today to see a live demo.