Our employee engagement and wellbeing solutions are designed to empower leaders, managers and employees to measure, analyze and improve on their workplace performance. To be able to do all that, we pay special attention to our customer needs and listen to their feedback to constantly deliver the best possible solutions.
We want to make sure that our customers use our products at their full potential. Therefore, we decided to create a series of monthly posts where we dive deeper into some of the most used features and also some functionality our clients might have missed from our products.
Why heat map
If your poll contains various categories, instead of viewing each set of categories separately, you can configure a heat map to give you an overview of the results:
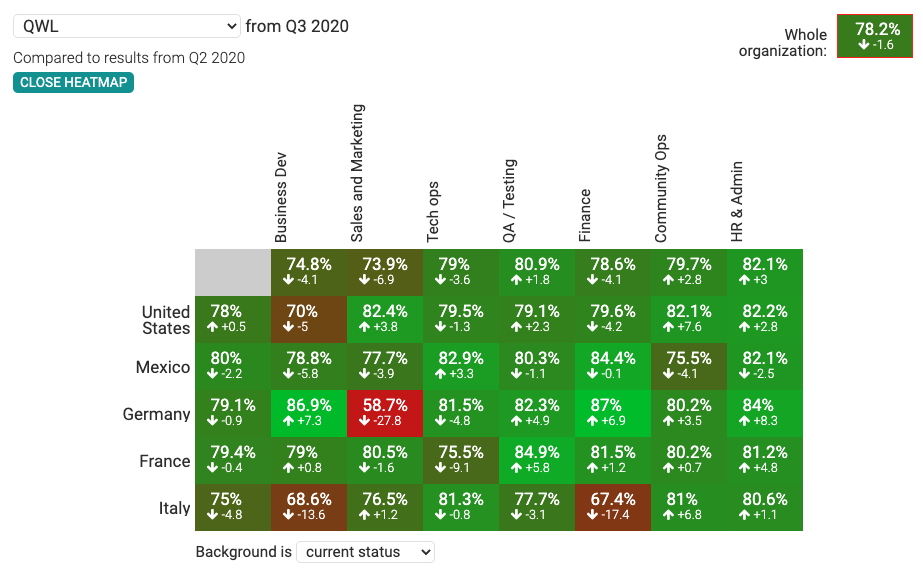
When configuring the heat map, you can define which category is used on the horizontal axis (in the picture above we have selected Country-category) and/or which category is used in the horizontal axis (in the picture above, Function-category).
You can then see the results - by default, the QWL-index - of each category combination. The color corresponds to the score and the arrow and number below the score indicates the change from comparison period to the current period.
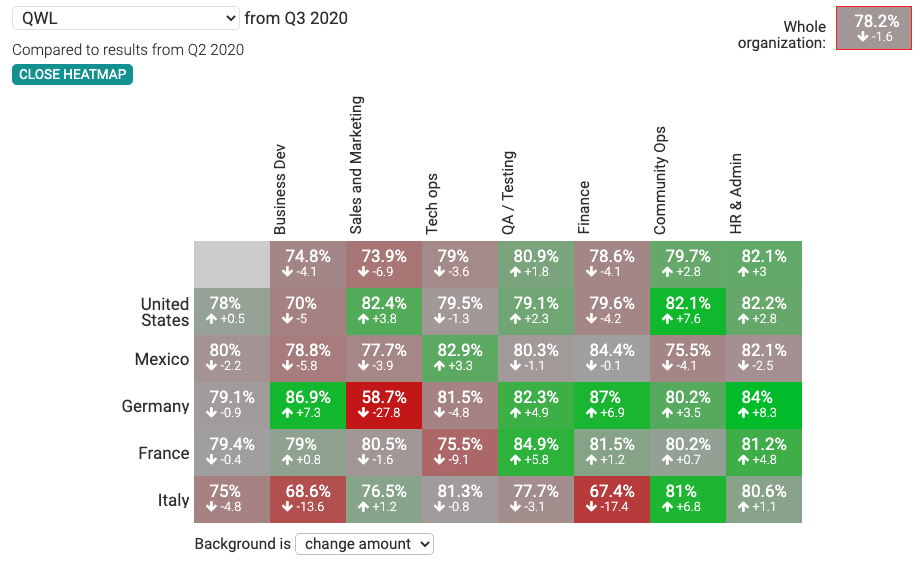
By using the pulldown menu below the heat map, you can change the colorization to reflect the amount of change instead of the current score:
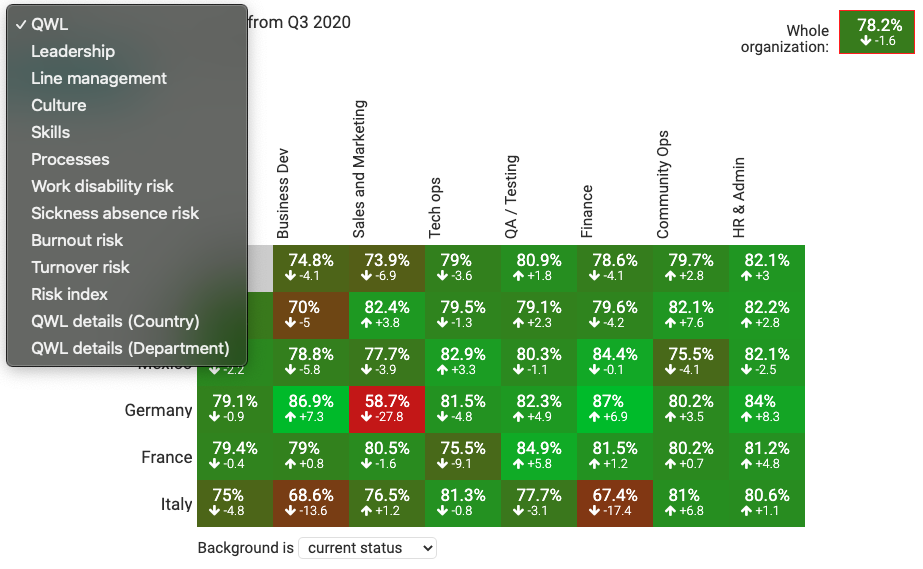
The following options are available for QWL polls:
- QWL-index (=average of the five areas (Leadership, Line management, Culture, Skills and Processes) measured by QW
- Each of the five areas individually
- Number of identified risks for each risk type (work disability, sickness absence, burnout and turnover risk)
- View for displaying all the above data for categories for each category in one view
- Each KPI you have defined
- Each question you have defined (excluding questions that do not have a numerical rating)
- View for displaying all the above data for categories for each category in one view
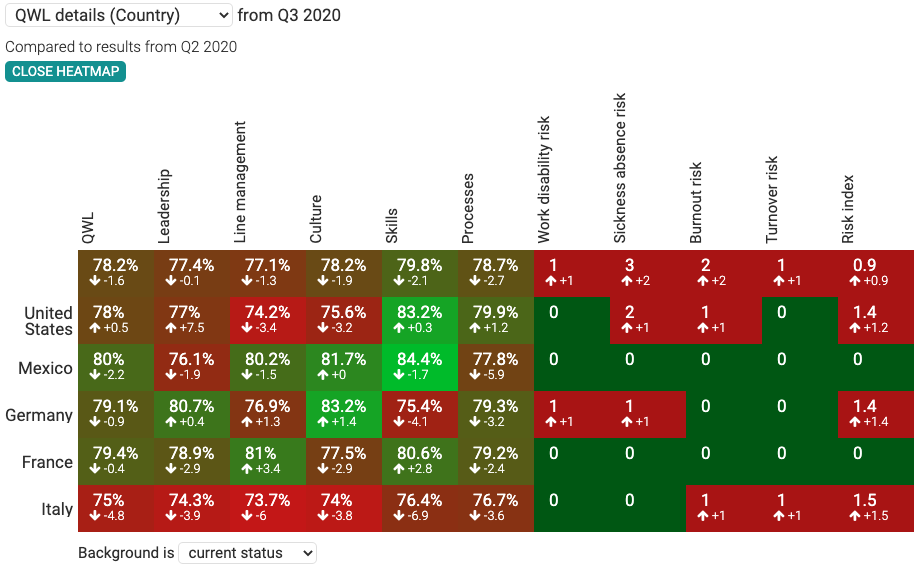
In our example, we have selected the Country-category to be used as the vertical axis - so if we choose “QWl details (Country)”, we see all the heat-map sections for each Country in one view, but Department information is not visible:
Viewing reports
You can easily view each Country/Department -report by simply clicking a heat map cell. If you are viewing the default view (=QWL-index), the report’s front page will be displayed. If you are viewing a specific heat map area, for example Skills, the relevant section in the respective report will be automatically opened for you.
To switch between the report for the current and comparison period, click the tabs on top of the filter bar, below the heatmap:

Configuring heat map
You can enable heat map for your poll in the poll’s settings, in “Heat map configuration”-section. The following options are available:- Enable heatmap - check this option to enable heat amp, uncheck to disable it
- Heat map vertical axis - choose which category to use**
- Heat map horizontal axis - choose which category to use**
- Date range - choose if your heat map data should be grouped quarterly, annually. Alternatively you can specify the period length to be a custom number of days. Heat map values are calculated from the most recent period containing data, and compared against values from the second most recent period.
- Calculate trend - Enable this option to calculate enable comparisons in the heat map
- Heatmap default visibility - Heatmap can take up a lot of screen real estate: if this option is checked, the heatmap is not displayed by default, but a “show heatmap”-button is instead. This is purely a cosmetic tweak and does not affect who has access to heat map data.
Feel free to experiment with the settings! You can change them at any point: before, during and after the poll is conducted.
Heat map access
You can define how heatmap is displayed in the poll’s settings:
- Heat map configuration -section: Heatmap for poll administrators only - By checking this option, only logged-in poll administrators can see the heat map. Users viewing shared reports would not see the heat map.
- Heat map configuration -section: Sharing visibility - If you use Share URLs to share reports, they might limit the categories report viewers are allowed to see. For example a country-specific report might only allow the user to view data from Canada. By checking this option, the viewer would be shown a heatmap containing values from all countries. However, the viewer would not be able to click those countries to view a detailed report. If this option is not selected, the heatmap shown to the viewer would only show heatmap cells in Canada.
- Heat map visibility in Sharing of poll results: Each Share URL contains a checkbox “Hide heat map”. If that checkbox is checked, heat map will be hidden in the corresponding report.

What is VibeCatch?
VibeCatch is an HR platform based on 15 years of proven research, offering you the opportunity to make a genuine difference and understand the impact that your working environment has on your staff.
Through VibeCatch’s QWL Polls, Pulse Polls and 360 Feedback Polls, you can uncover hidden staffing opportunities, correct issues and address areas of improvement for both employees and management within your organization.
Speak to our team today to see a live demo.