Our employee engagement and wellbeing solutions are designed to empower leaders, managers and employees to measure, analyse and improve on their workplace performance. To be able to do all that, we pay special attention to our customer needs and listen to their feedback to constantly deliver the best possible solutions.
We want to make sure that our customers use our products at their full potential. Therefore, we decided to create a series of monthly posts where we dive deeper into some of the most used features and also some functionality our clients might have missed from our products.
How individual-level results are calculated
Although in most cases QWL polls are anonymous and responses are often viewed via country, business unit, or team -level aggregations, QWL report also provides individual-level risk analysis. With individual-level analysis, results such as QWL index, self-esteem factor realisations and risk identification are calculated only by inspecting each person’s individual poll responses.
Identified risks and how they are displayed in QWL report
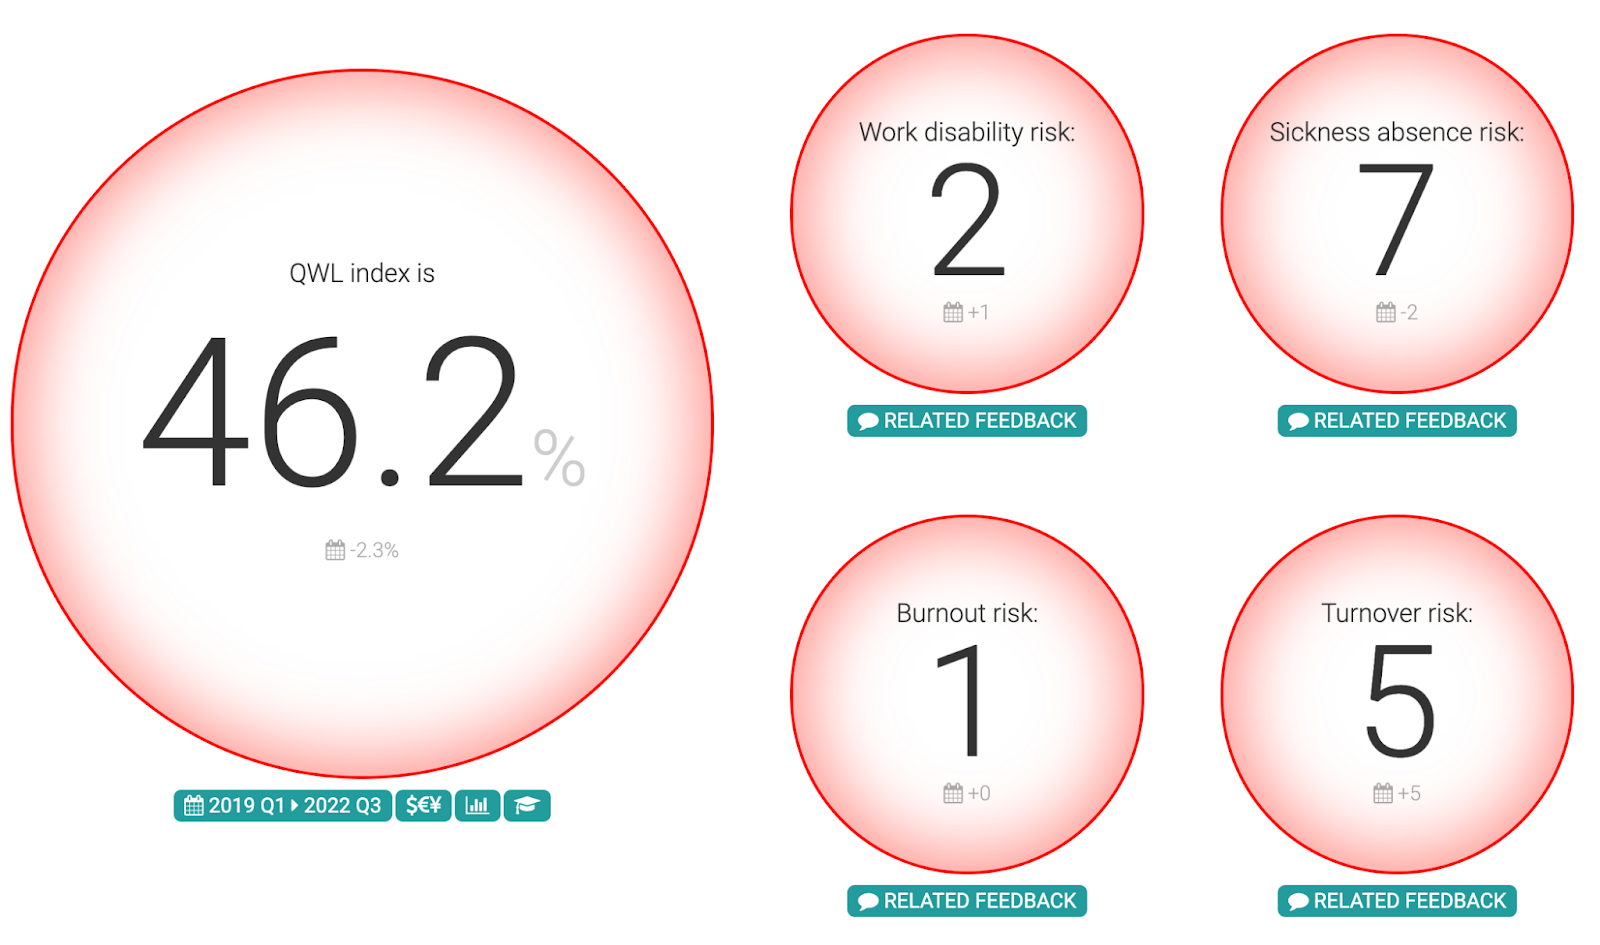
- Work disability risk - this risk which is identified if person’s individual-level QWL falls below a threshold value (by default 30%)
- Sickness absence risk - a risk which is identified if person’s individual-level physical and emotional safety falls below a threshold value (by default 60% or less)
- Burnout risk - a risk which is identified if a person's physical and emotional level of physical and emotional safety is low (by default 65%) but social cohesion and identity is high enough (75%) and goals and creativity is also high enough (75%). “I can not decline to take on additional workload because I am too scared and I can’t let my colleagues down.”
- Turnover risk - in a way an inverse of burnout risk: this risk is identified if a person's physical and safety is high enough (70%) and social cohesion and identity is low enough (65%) and goals and creativity is also low enough (65%). “I have the mental energy to search for more meaningful work elsewhere.”
The important thing about the displayed risk numbers is that they are not any sort of indexes, but instead the numbers directly represent the number of individuals for whom those risks are identified.
Viewing risk details
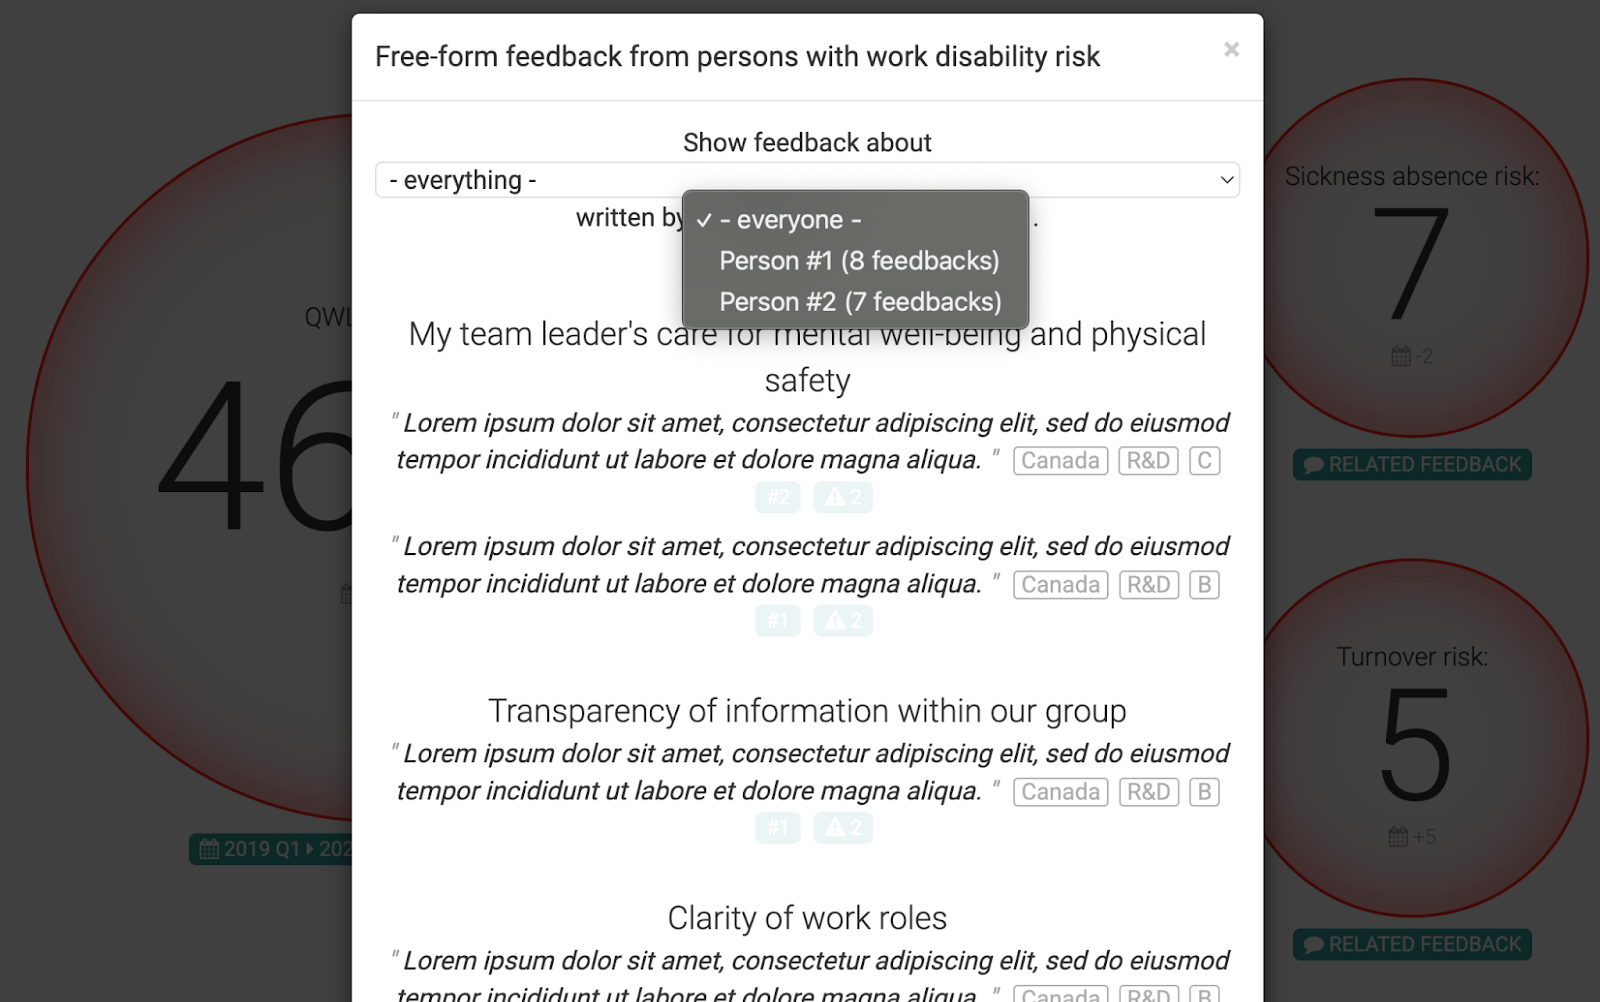
If any of the poll responders with identified risks have left free-form -feedback, you can click the “Related feedback”-button to view feedback and poll-results specific for those poll responders with that specific risk type.If there is feedback from more than one poll responder- even though all feedback is anonymous - you can choose which feedback responder’s feedback you want to view by selecting that person form a pulldown menu:
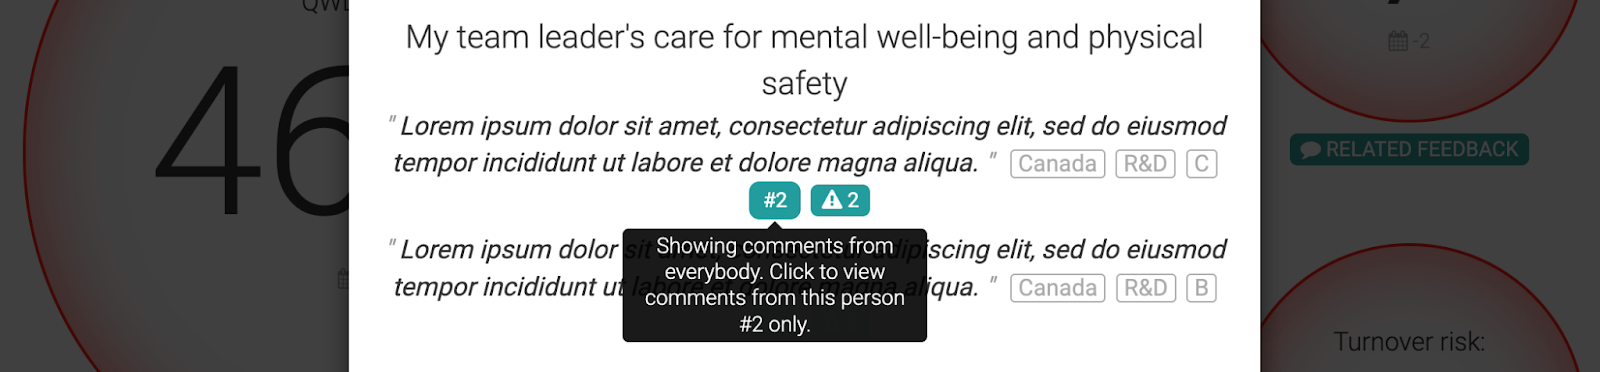
Another way of filtering feedback by responder is to click the small number button next to the free-form feedback.
To view detailed information about each poll responder’s risks, click the small button with the warning arrow icon.
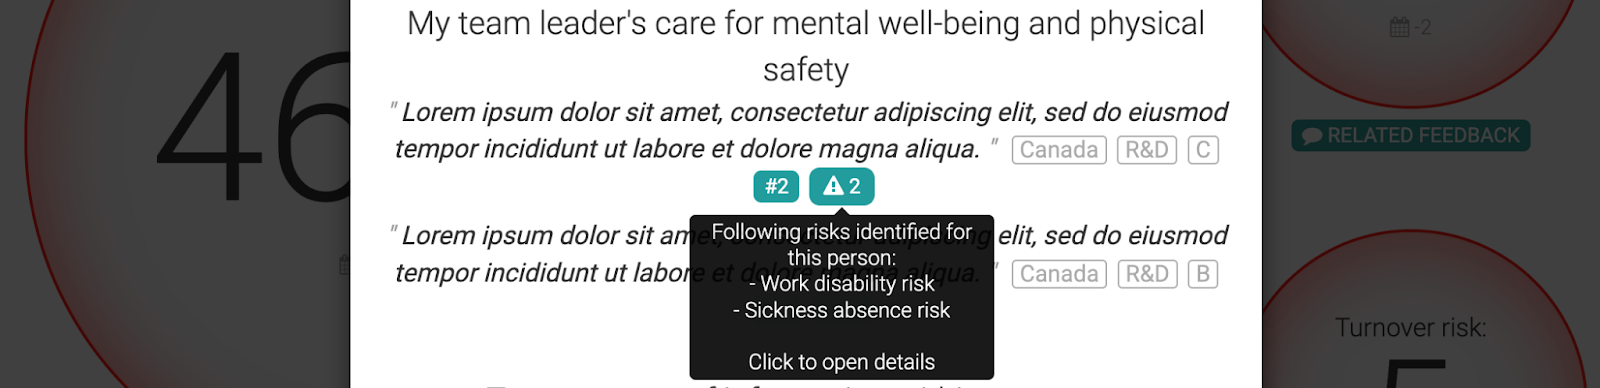
You will be presented with a display like this:
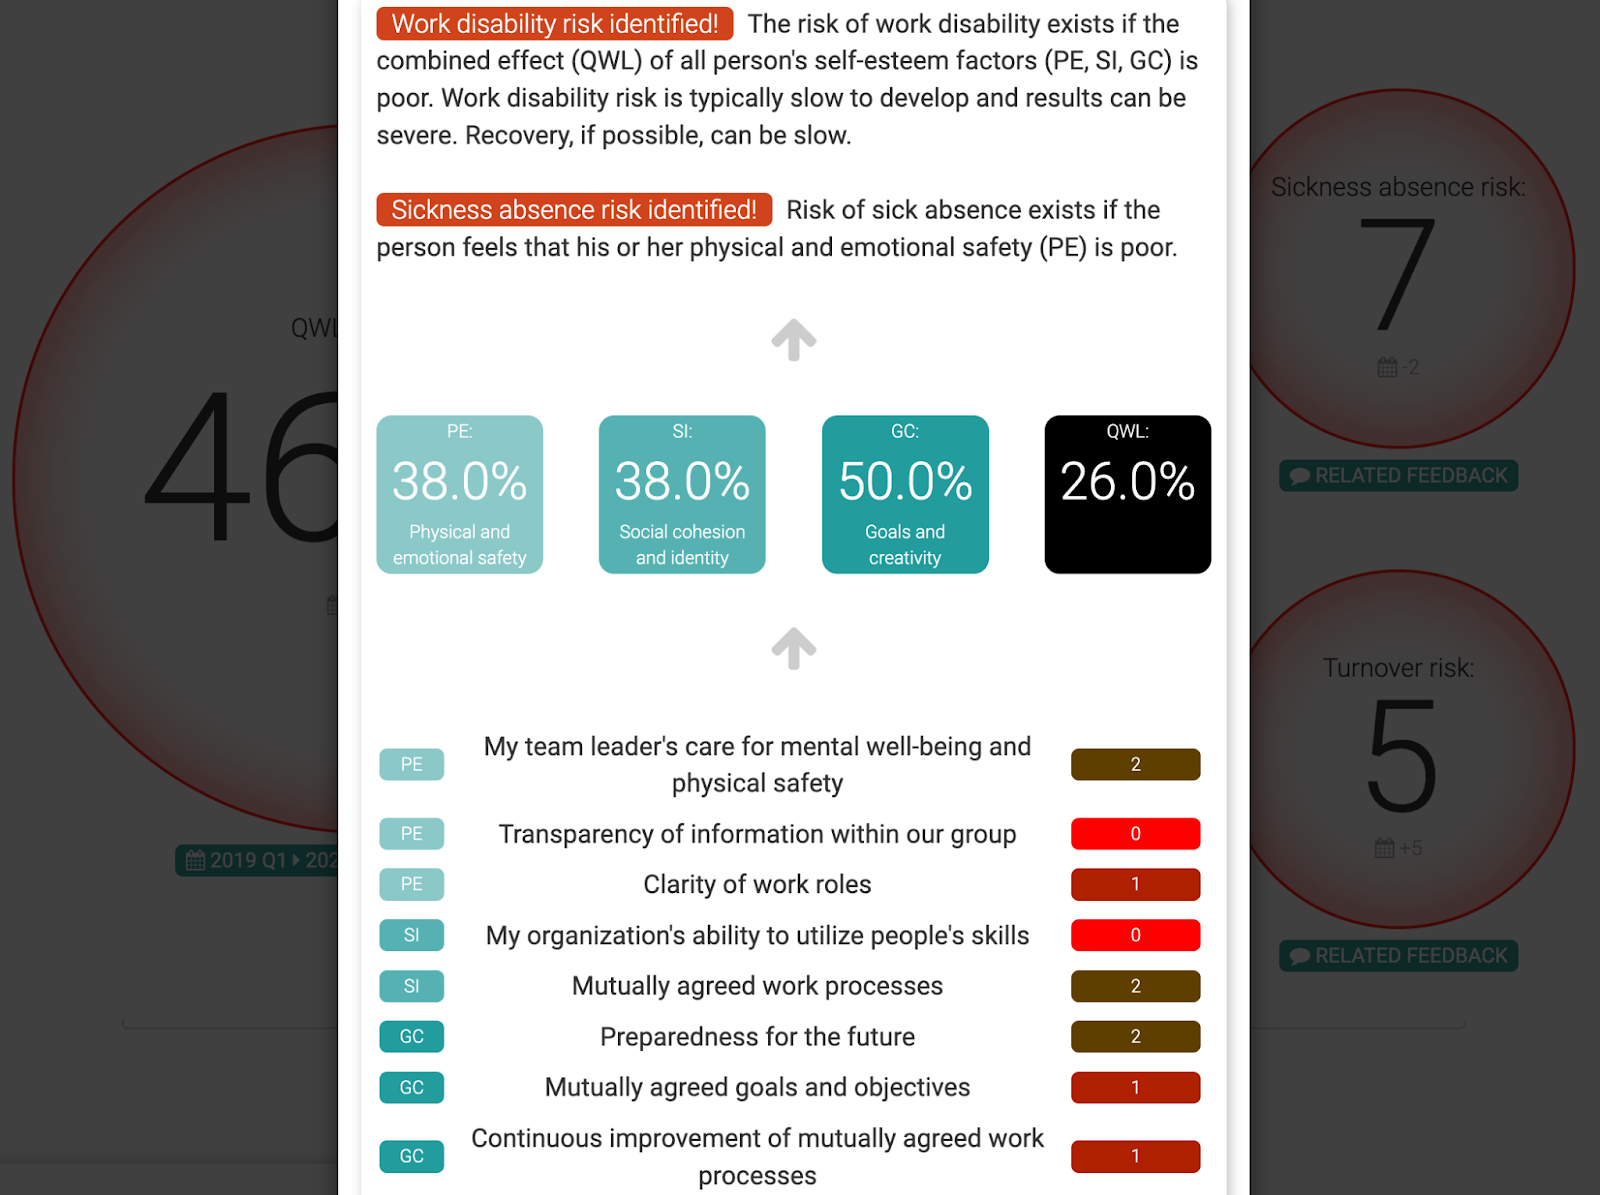
At the top, the display will show the identifier risk or risks, and explanations how those risks are identified.
Below the risks, individual-level self-esteem factors are displayed, along with the individual-level QWL score. These numbers are calculated from that specific poll responder only and responses from other individuals have no effect on these results.
At the bottom you will see each question in the QWL report, the poll responder’s numerical rating for that question and which self-esteem factor that question belongs to. If that person has left any free-form text feedback for any question, the feedback will be shown if you hover your mouse cursor over the questions. The questions are ordered according to the self-esteem factors that they measure: as physical and emotional safety -self-esteem factor (PE) is the most significant when identifying risks, those questions are displayed first.
Individual-level QWL index distribution among poll responders
Back in the QWL report you will find a “Show distribution” -button below the QWL and risk indicators. Click that button and a graph is displayed:
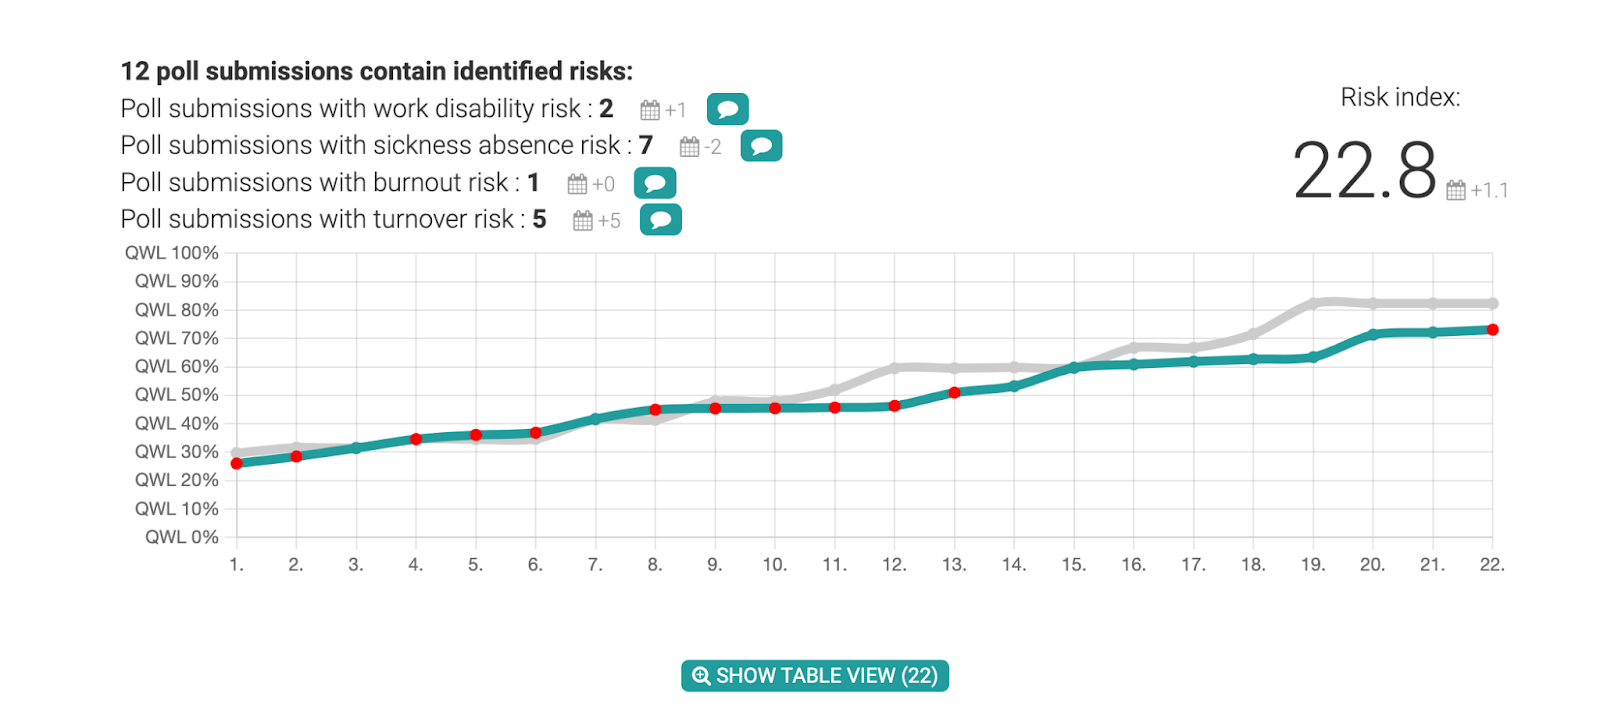
Each data point in the graph represents one poll responder. The data points are sorted in ascending order of QWL index: the most unsatisfied responders are on the left side of the graph and the responders on the right are the most satisfied. A data point / person is highlighted in red if one or more risks are identified for that individual. Click any of the red or green data points to open a detailed view (as described above) specific for that poll responder.
If you have conducted the same QWL poll previously, a comparison line is drawn based on the QWL distribution based on the responses from the previous polling round. Thus, you can easily see how the sentiment has changed - for example, in the screenshot above you can see that on average, the most satisfied employees are a tiny bit less happy, but the most unhappy employees feel about the same. An important thing to keep in mind, is that both graph lines are sorted according to the QWL score: thus, for example, person #17 is the “current qwl” line is not necessarily the same person as person #17 in the “previous poll” line.
The results shown above can be also viewed in table form: click the “Show table view” -button to view it.
Poll configuration options related to risk identification
VibeCatch has the ability to inform individuals about identified risks immediately when the poll responder submits his/her poll responses. This enables instant action: people in risk can be automatically and instantly directed to get help, while at the same time retaining anonymity. This feature can be enabled in poll settings (Settings > Text in the Poll Form > Identify risk immediately when feedback has been sent -checkboxes). If one or more risk type notifications have been enabled, a text field will be displayed where you can write the text which will be displayed to individuals if any of the selected risks are identified. VibeCatch contains no default placeholder text for these fields, as in most cases you want to provide organization-specific occupational health care contact information or other non-generic information..
Risk counts and individual-level QWL distribution can be considered somewhat sensitive data. Because of that, you might want to share a report that does not contain identified risk counts and individual-level graphs. You can easily hide these sections from a shared report by clicking “Show details” (in Settings > Sharing of poll results) and checking the “Hide individual-level risk indicators”-checkbox.
As it is possible to fine-tune QWL questions to best suit your organisation, it is also possible to fine-tune the risk-identification analysis. For example, you can tweak the parameters so that the previous quarter’s QWL poll’s risk absence counts exactly match the number of sick absences your employees actually had in the previous quarter, thus making the risk-identification analysis to be an exact match with how your organisation works.
Contact support@vibecatch.com for more information - the risk-identification parameter tweaking is free of charge.

What is VibeCatch?
VibeCatch is an HR platform based on 15 years of proven research, offering you the opportunity to make a genuine difference and understand the impact that your working environment has on your staff.
Through VibeCatch’s QWL Polls, Pulse Polls and 360 Feedback Polls, you can uncover hidden staffing opportunities, correct issues and address areas of improvement for both employees and management within your organisation.
Speak to our team today to see a live demo.